Recently my fourth grade technology class has been learning to create charts using Google Spreadsheets. They were given a variety of data sets to chart which were all based on their current study of the US States. Different data requires different types of charts, and they have built column and bar charts, pie charts, and line charts. We always share our learning via the student blogs and so in order for them to be able to embed one of their charts into a post, I needed to provide an example and work out the kinks before teaching them the embed process. In Google charts there is an option for an embed code, allowing the chart to be interactive, and also automatically updated in the embedded view if the data is changed.
1. In your Google chart select the option to Publish Chart.![]()
(I would suggest using the move and resize option in the chart to center the chart first as best you can before heading to publish.)
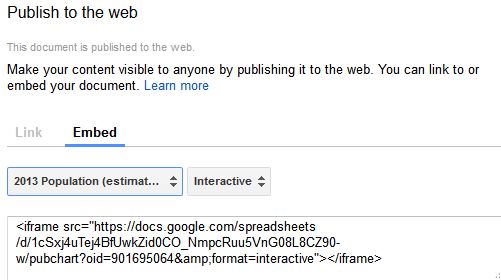
2. Copy the embed code:
Since the embed code does not offer size attributes the first insertion could look something like this.
As you can see there is very little of the chart visible and it is hard to get the complete picture having to do so much scrolling. What to do?
3. Head into the Text/HTML view and take a look at the embed code. Example:
<iframe src=”https://docs.google.com/spreadsheets/d/1cSxj4uTej4BfUwkZid0CO_
NmpcRuu5VnG08L8CZ90-w/pubchart?oid=2091869464&format=interactive””></iframe>
Note: Sometimes you will have size attributes in the embed code but in my experience most times they do not appear.
4.. Add size attributes or change existing size attributes and continue to tweak until the size fits your page. Here is an example of the size attributes and the resulting layout on an early attempt.
<iframe src=”https://docs.google.com/spreadsheets/d/1cSxj4uTej4BfUwkZid0CO_NmpcRuu5VnG08L8CZ90-w/pubchart?oid=901695064&format=interactive” width=”650″ height=”400″></iframe>
![]() The width of 650 is too wide for the WordPress theme I am using. The arrow indicates how far into the right side bar the image extends. Since the height of the chart appeared to work, it is just a matter of tweaking the width.
The width of 650 is too wide for the WordPress theme I am using. The arrow indicates how far into the right side bar the image extends. Since the height of the chart appeared to work, it is just a matter of tweaking the width.
It seems that a width of 530 px is the best for my current page. Here is the final embed code. There is minimal scrolling and the whole chart is visible.
<iframe src=”https://docs.google.com/spreadsheets/d/1cSxj4uTej4BfUwkZid0CO_NmpcRuu5VnG08L8CZ90-w/pubchart?oid=901695064&format=interactive” width=”530″ height=”400“></iframe>